|
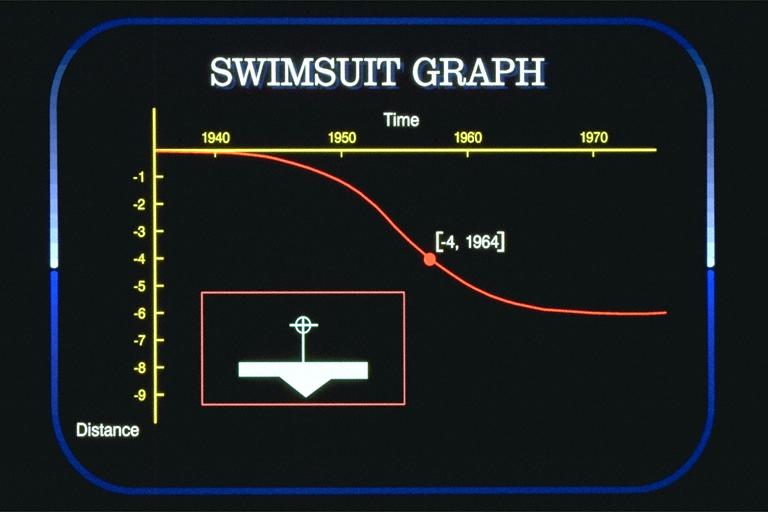
North America 1940-1970 BSD8820 Costume Lowering waistline. M. N-n. The issue is bellage. Actions The Lowering Waistline Swimsuit Graph (1) plots the location of the waistline of bikini culotte in inches below navel vs time. Time moves to the right, and the lowering waistline moves down. For example, the curve passés through the point (-4, 1964). The chart begins in 1940, before the bikini bottom exposes the navel. The curve begins to move after 1945 and the graph suggests the navel becomes exposed circa 1950. It animates itself down the hips during the early 1960s until it reaches its minimal state by the late 1970s. During the 30-odd years, the waistline retreats six inches, or an average of slightly less than 1/4 inch per year.In theory, exhibitionists lead the inhibited and tend to arrive at points on the graph sooner. Legline remains more or less constant, but the declining waistline makes the culotte narrower at the side. The inevitable collision between waistline and legline minimizes in a string closure. In the Post-Minimalist period that follows this graph, the 1980s Although the width of the side of the string culotte is determined by the waistline and legline, in the period that follows this graph--the Post-Minimalist 1980s--the legline and waistline rise together, with the waistline rising every so slightly faster than legline, so that the closure is broken, and a wider sidestrap evolves. This is the route toward v-kini and it produces a scouped waistline--high to the side but low at the pelvis and back--rather than the now and straight 1970s silhouette. Commentary The lowering waistline is an example of the shifting erogenous zones theory, a practice that has been with us since Eden. Source Judson Rosebush, Second Skin Manuscript, 1988. 1 picture. |
|